This article is from the Australian Property Journal archive
EVERY one of Brisbane’s suburbs saw house and unit prices rise over the past year, while Adelaide and Perth had just a couple of suburbs that bucked the trend, amid a raging imbalance of supply and demand.
Over the past 12 months, CoreLogic’s Home Value Index has risen 8.9%, adding the equivalent of approximately $63,000 to the national median dwelling value – now at $765,762 – and taking the index to a new all-time high in February.
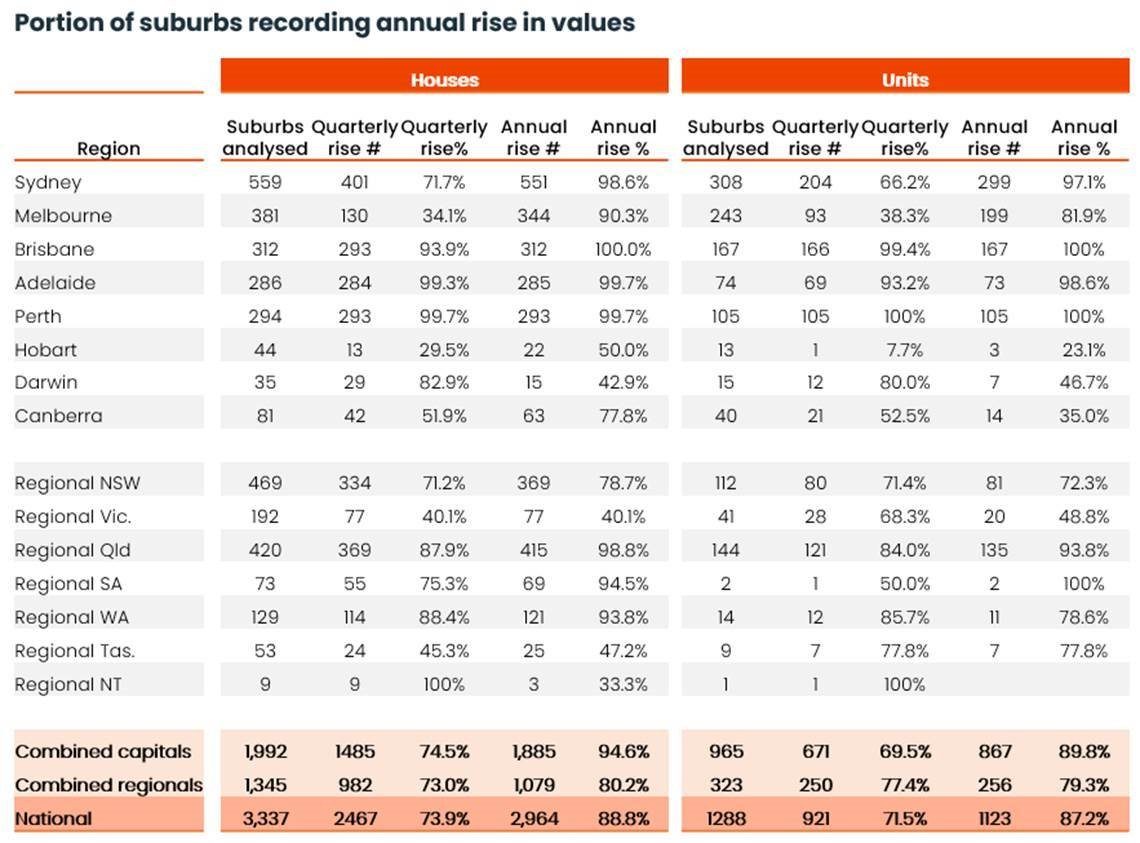
Suburb-level analysis using CoreLogic’s interactive Mapping the Market tool found that 88.4% of house and unit markets analysed nationally – or 4,087 out of 4,625 – saw values rise over the year. This is up from just 52.9% of markets in July 2023 (2,456 out 4,640), and up from the 39.1% that recorded positive annual growth in February 2023 (1,851 out of 4,732).
All 312 house and 167 unit markets analysed in Brisbane saw values rise. The inner-city suburb of East Perth was the only market in the western capital to record a decline in house values, while Adelaide saw only Black Forest’s housing market and the Glenelg South unit record modest falls.
Positive net migration flows, low housing supply and comparatively low housing prices have all helped support widespread growth across these markets, according to CoreLogic.
The data also shows that the majority of suburbs recorded double-digit value growth.
In Perth, 93.7% recorded a capital gain of 10% or more over the year. Brisbane saw 86.4% of house and unit suburbs rise by more than 10%, and three quarters of Adelaide markets recorded double-digit annual growth.
Brisbane, Adelaide and Perth each posted very strong quarterly percentages of suburbs recording growth, while Melbourne fell away from 90.3% in annual terms to 34.1%, and Sydney from 98.6% to 71.7%.
Brisbane’s top-performing markets for quarterly growth were concentrated in the more affordable Logan-Beaudesert, Ipswich, and Morton Bay regions, as affordability issues and borrowing constraints hit inner city regions including Hamilton and Ascot.
Hobart dropped to just 29.5% in the quarterly figures, continuing two years of softness after a burst in growth from 2017 to 2022.
“Relatively loose supply levels and negative interstate migration, coupled with the city’s relatively unaffordable price point relative to local incomes, have all likely contributed to falling values over the past two years,” CoreLogic said.
Rents rise
CoreLogic also found that 94.2% of house and unit markets analysed recorded an annual rent rise, and nearly 40% saw rental values rise by 10% or more. The annual trend in national rent values bottomed out in October at 8.1% and has come back up since to 8.5% in February.
“Over the past few years, rental growth has been skewed to capital city units, but as unit rent affordability has been eroded, some prospective tenants may be shifting towards house rentals, likely reforming larger households as a way of sharing the rental burden or to more affordable markets further afield,” CoreLogic said.
Perth was by far the strongest-performing capital for annual rental growth, with all 245 house and 101 unit markets analysed recording increases over the year, and with 82.4% of houses and 94.1% of unit markets seeing an annual rent rise of 10% or more.
Hobart sat at the opposite end of the scale – just seven of the 39 house markets analysed posted a, while all 13 of the unit markets analysed saw a decline.