This article is from the Australian Property Journal archive
RESIDENTIAL property listings across Australia jumped by 9.3% to mark the start of the spring season, whilst older stock continues to rise along with a modest increase in distressed properties.
According to SQM’s latest data, there 245,445 listings in September compared to 224,530 properties in August, led by a substantial rise in new listings across all capital cities.
SQM Research managing director Louis Christopher said the spring selling season is living up to its name once more with a large jump in new listings for September. Nationally, September was the strongest new listings month since April 2022. It was also the strongest September since 2018.
Vendors were right on cue at the beginning of spring, new listings (less than 30 days) surged by 14.3%, adding 77,621 new property listings to the market. Notably, Sydney, Melbourne, and Canberra outperformed the national average with increases of 12.7%, 10.0%, and 13.9%, respectively.
Canberra recorded the largest percentage increase for any capital city with a 16% increase in total listings, driven by a 13.9% increase in new listings for the month.
Sydney new listings rose by 12.7%, taking the total increase by 12.2% to 15,531 properties, which is 24.8% higher than a year ago. Similarly, a 10% rise in new stock pushed Melbourne’s total listings up by 10.5% to 16,580 properties.
Hobart experienced a remarkable surge in new listings, with a 45.7% jump over August.
Meanwhile, both Brisbane and Darwin also saw growth in their new listing numbers, registering increases of 3.4% and 27.6%, respectively.
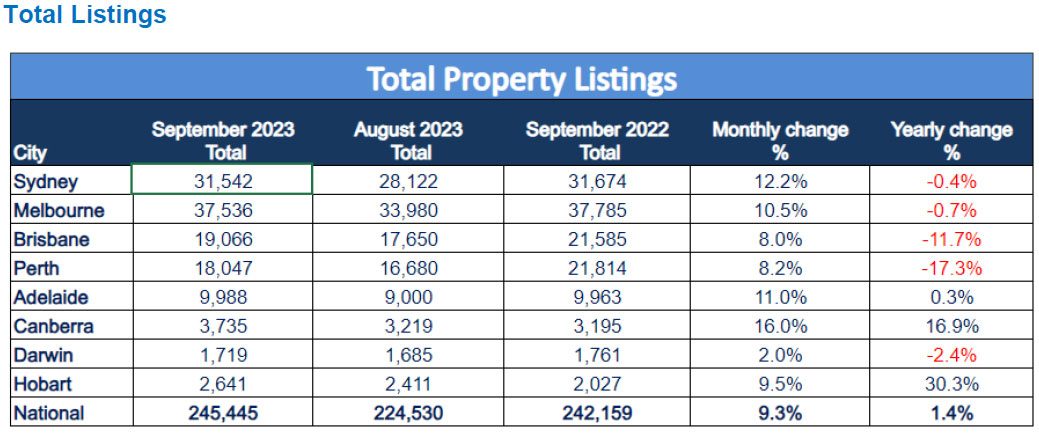
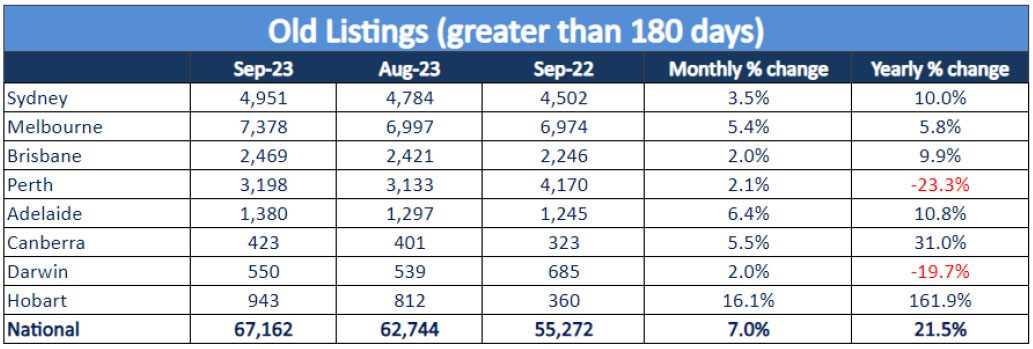
Over a 12-month period, listings are up by 1.4% across the country, led by Hobart with a 30.3% increase.
“The pick up in new listings is a sign of confidence from vendors that the current market is offering good selling conditions. Buyers would also be noticing the increase in choice of stock.
“However, a note of caution as we also did record a rise in older stock which suggests there are vendors with overly lofty pricing expectations in the market. And while activity has increased in 2023, it is not a boom market by any means,” said Christopher.
SQM data also shows older listings (properties listed for over 180 days) increased by 7.0%, marking a 21.5% rise over the past 12 months. All cities recorded a rise in older stock during the month.
At the same time, SQM found distressed listings has risen to 5,246, reflecting an increase of 1.3% compared to the 5,180 properties in August.
This was primarily driven by increases in New South Wales (4.0%), Victoria (1.5%), Western Australia (3.6%), and a substantial 11.1% increase in the Australian Capital Territory compared to the previous month.
In contrast Queensland and South Australia recorded a decrease in distressed listings.
Asking prices increased by 0.9%, reflecting a 8.1% rise compared to September 2022.
Christopher said there was a significant surge in asking prices for all units, with a substantial increase of 2.0%. Sydney saw a notable increase of 1.7%, while Melbourne showed a more cautious rise of 0.6%, indicating some restraint among vendors in Melbourne.
Brisbane recorded a substantial uptick in asking prices, rising by 1.5% for the month and registering an overall increase of 9.8% over the past 12 months.
“The rise in asking prices generated new record highs at the national level as well as the capital city level,” he added.
New record highs were set for Sydney, Brisbane, Adelaide and Perth. The highest recorded median asking price was Sydney Houses, which reached $1,873,000. The most affordable capital city asking price was Darwin units at $374,000.
Meanwhile REIWA data shows listings in Perth have fallen their lowest levels in 30 years over September, while house prices reached a new record high.
Listings drop below 5,000 to 4,931 at the end of September, down 4.9% on the final figures for August and down 39.5% for the year.
The median house price hit $570,000, surging 5.6% from the same time a year ago and 4.6% higher than the previous record set in 2014-15.
The median unit price remained stable at $400,000 and was 2.4% lower than September 2022 and 2.9% below the previous high of $412,000 set in 2021-22.
“The strength of demand was highlighted in the median time to sell a property, which dropped to a record low of nine days for the month,” said Cath Hart, CEO at REIWA.
With the fastest selling suburbs for houses in September including Dudley Park and Seville Grove at three days, Coodanup, Cooloongup and Secret Harbour at four days and Armadale, Tapping, Butler, Caversham and Greenfields at five days.
“It’s interesting to see that, with the exception of Tapping, these suburbs have a median house price below the Perth median. It suggests affordability is important and buyers are acting quickly when they see value,” added Hart.
“These suburbs also offer rental yields between 5 and 7 per cent, which make them very attractive to investors.”
While according to the CoreLogic Home Value Index, Perth was among the top three performers for September, recording 1.3% in growth over the month.
Perth’s median rents held at record highs in September. With the median weekly dwelling rent was $580/week, unchanged from the August and 17.2% higher than a year ago.
“Stability is very welcome, but market conditions suggest more increases are likely in the coming months,” said Hart.
“WA is experiencing strong demand and there is a limited supply of rentals available. The significant imbalance between supply and demand is putting pressure on prices and this is unlikely to change in the near future.”
At the end of September, there were 1,653 properties available for rent, up slightly for the month but 22.2% lower for the quarter and 4.1% lower for the year.
While it took a median of 14 days to lease a rental during September, one day faster than August.