This article is from the Australian Property Journal archive
Negative equity has returned to haunt the property markets in the Sydney, Brisbane and Victoria as property values continue to fall in the Eastern States, according to Australia’s largest mortgage broker AFG.
Negative equity is when property values fall to the extent that mortgages are greater than the value of the properties they are secured against.
AFG warns that negative equity has returned to haunt property markets in the Eastern States, with certain property types in Sydney having declined by as much as 20% in the past 12 months.
According to AFG, some property types and suburbs in Brisbane and Victoria have also been adversely affected.
AFG’s figures for August show that mortgage sales in New South Wales have remained flat over the past year from $545 million in 2005 to $552 million.
Meanwhile in Western Australia mortgage sales jump over 40% during the same period from $313 million in August 2005 to $582 million in August 2006.
AFG’s executive director Malcolm Watkins said while figures for the national mortgage market may appear to be holding steady, we need to look below the headline trends.
“If you have your head in the oven and feet in the freezer, your overall body temperature is normal. What we’re seeing is a booming WA property market taking rate rises in its stride, while some types of properties, in Sydney especially, are falling significantly in value.
“If larger numbers of owners are forced to sell, this will trigger even greater declines affecting more property types,” he added.
Watkins said many owner-occupiers, seeking to refinance their homes, are being disappointed by the lower than expected valuations being achieved.
According to the AFG Mortgage Index, the average mortgage size in Australia is $306,000.
NSW continues to have the highest average mortgage on $377,000 – compared to $366,000 a year ago – followed by WA on $340,000 – a 30% increase compared to $260,000 a year ago.
The average mortgage size for Queensland is $288,000 compared to $256,000 in August 05 and South Australia on $224,000 compared to $217,000 in August 05.
Victoria had the lowest mortgage size on $283,000 compared to $264,000 in August 05.
According to AFG, across this sharply contrasting picture, property buyers have one thing in common – concerns about further rate rises.
In August, AFG Mortgage Index also shows a record number of property buyers opting for Fixed Interest Rate mortgages, with 22.6% choosing this option, compared to just 9% a year ago.
AFG has identified a number of high risk negative equity property types, including;
- Land/construction projects in Queensland, some of which are currently being valued at 20% less than asking price;
- Tighter valuations for Melbourne properties, in many cases showing no growth or declining values during the past 12 – 24 months;
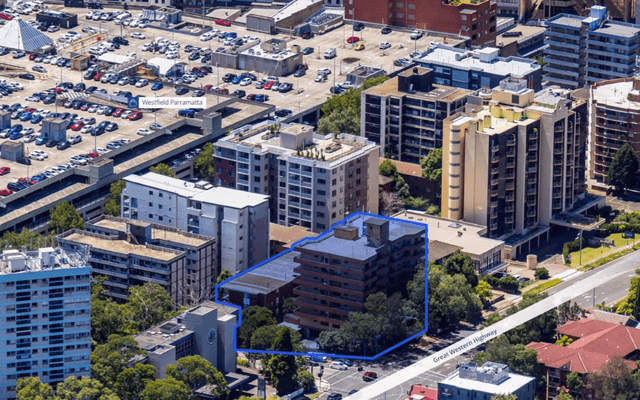
- Strata property in the inner south west area of Sydney, particularly around Green Square, where values have also slumped by as much as 20%;
- Units in an over-supplied Sydney market, especially those which have been sold “off the plan” where developers and investors are renting, instead of selling stock, for fear of triggering further price declines;
- Declines in Sydney of 10% – 15% for unit developments around Homebush Bay, and 5% – 10% declines for those in the outer northern suburbs, such as Waitara and Hornsby;
By Kathryn O’Meara and Nelson Yap
AFG Mortgage Index – August 2006 AFG – First with the Figures
AFG Mortgages Sold
Table 1: Australia
|
MONTH
|
TOTAL NUMBER
|
TOTAL AMOUNT
|
AVERAGE SIZE
|
PROPERTY
INVESTORS
|
|
Jul 05
|
6,469
|
$1,780 bn
|
$270k
|
23.0%
|
|
Aug 05
|
7,240
|
$2,010 bn
|
$277k
|
23.4%
|
|
Sep 05
|
6,624
|
$1,874 bn
|
$282k
|
24.2%
|
|
Oct 05
|
6,469
|
$1,831 bn
|
$283k
|
25.5%
|
|
Nov 05
|
7,988
|
$2,276 bn
|
$285k
|
23.4%
|
|
Dec 05
|
5,633
|
$1,611 bn
|
$286k
|
25.2%
|
|
Jan 06
|
5,601
|
$1,537 bn
|
$274k
|
27.8%
|
|
Feb 06
|
7,121
|
$2,032 bn
|
$285k
|
27.8%
|
|
Mar 06
|
7,747
|
$2,275 bn
|
$293k
|
27.8%
|
|
Apr 06
|
6,667
|
$1,965 bn
|
$294k
|
28.3%
|
|
May 06
|
8,648
|
$2,604 bn
|
$301k
|
31.3%
|
|
June 06
|
7,599
|
$2,323 bn
|
$305k
|
31.2%
|
|
July 06
|
7,262
|
$2,222 bn
|
$306k
|
31.6%
|
|
Aug 06
|
8,158
|
$2,502 bn
|
$306k
|
31.6%
|
Average Mortgage Size In Dollars
Table 2: State By State
|
MONTH
|
AUSTRALIA
|
NSW
|
QLD
|
SA
|
VIC
|
WA
|
|
2001
|
186,943
|
247,879
|
174,689
|
125,065
|
197,329
|
185,612
|
|
2002
|
212,924
|
300,320
|
191,607
|
148,301
|
211,573
|
193,057
|
|
2003
|
231,453
|
335,302
|
215,425
|
172,520
|
233,690
|
198,237
|
|
2005 08
|
277,696
|
366,961
|
256,594
|
217,660
|
264,515
|
260,435
|
|
2005 09
|
282,987
|
369,684
|
267,499
|
228,808
|
250,599
|
272,579
|
|
2005 10
|
283,159
|
377,742
|
266,999
|
220,133
|
270,618
|
270,537
|
|
2005 11
|
285,002
|
372,203
|
272,832
|
212,530
|
274,373
|
264,916
|
|
2005 12
|
286,162
|
368,799
|
276,474
|
217,221
|
265,340
|
274,084
|
|
2006 01
|
274,492
|
373,163
|
259,228
|
215,336
|
247,920
|
282,808
|
|
2006 02
|
285,414
|
373,471
|
266,482
|