This article is from the Australian Property Journal archive
BUYERS in Sydney and Melbourne have seen the highest surge in new listings for this time of year in over a decade, and Canberra in 20 years, bringing some reprieve from ongoing affordability constraints – and vendors will need to be “realistic” about their expectations moving into the spring selling season.
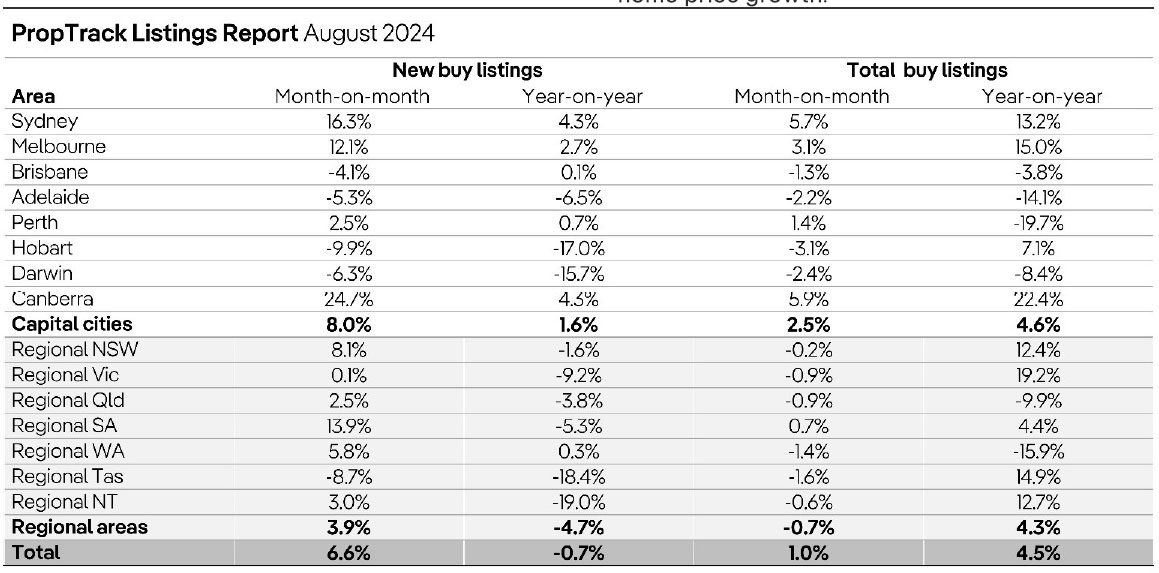
New PropTrack data shows new listing volumes in August nationally were 6.6% higher over the month, as the market moved into its busiest period, while volumes were 0.7% lower year-on-year. Listings were higher across the capitals in annual terms, and lower throughout the regions.
The annual rise in new listings was largest in Sydney (4.3%), Melbourne (2.7%) and Canberra (4.3%) – which respectively saw their highest number of new listings for an August since 2012, 2011 and 2004.
That contributed to total listings nationally being 1% higher over the month and 4.5% higher than a year ago, marking the 11th consecutive month that total listings have been higher year-on-year.
“We’ve still been seeing good sales volumes, while we’re starting to see the days on market increase a little bit. So people that are putting their properties on the market need to be realistic about their pricing because we are seeing more competition, particularly in Sydney and Melbourne, but also in those other capital cities that we’ve seen for a while now in terms of overall stock on the market,” PropTrack director of economic research, Cameron Kusher told Australian Property Journal.
“We’re already seeing the rate of price growth slow everywhere. It’s still very high in places like Brisbane and Adelaide, but we’re starting to see that rate of price growth roll over and more stock obviously takes the urgency out of the market.
Almost 30% of all suburbs across Australia’s capitals and regional areas saw a loss in housing values over the past three months, according to CoreLogic, with Melbourne and Perth driving opposite ends of the spectrum.
“We’ll probably see slower price growth going forward,” Kusher said.
New listings are slightly higher year-on-year in Brisbane and Perth, which have been amongst the leaders in house price growth recently. Falls were seen in Hobart (by 17.0%), Darwin (15.7%) and Adelaide (6.5%).
The picture is slightly different when it comes to total listings. Canberra (up 22.4%) led growth, followed by Melbourne (15.0%), Sydney (13.2%) and Hobart (7.1%). Perth saw the biggest drop (by 19.7%), then Adelaide (14.1%), Darwin (8.4%) and Brisbane (3.8%).
Regional Victoria, Tasmania, Northern Territory and NSW all saw robust growth in total listings in annual terms, with modest gains in regional South Australia. Regional Western Australia and Queensland are notably lower.
“Whether it’s out of necessity or whether it’s confidence that people can upgrade in this market, we’re seeing a lot of people putting their properties up for sale,” Kusher said.
“Higher interest rates for longer is probably driving some people to list their properties. I think in Melbourne in particular, the fact that the cost of owning an investment property has gone up may be driving it.
“In Sydney, probably more so than Melbourne, people have got a lot of equity in their property given how much prices have risen over recent years, and they might have been delaying upgrading for a while and now they’re taking the opportunity to do that.”