This article is from the Australian Property Journal archive
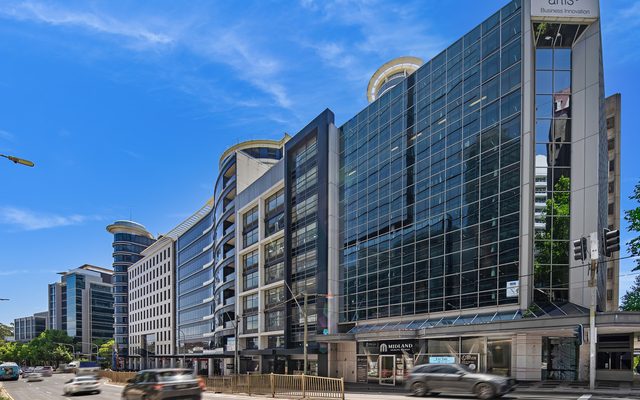
LAST month marked the busiest October for new capital city listings in a decade, as each major Australian city saw bump in available homes on the market.
According to the latest data from PropTrack, new national listing volumes were up 20.9% in over the month and 14.0% compared to October last year.
Over the month, each capital city recorded an increase in new listings with all except Darwin recording year-on-year growth.
With capital city new listings up 23.2% for the month and 15.2% for the year, compared to a monthly increase of 17.0% and a yearly increase of 11.9% for regional markets.
“Buyers across Australia enjoyed greater choice in October, with all markets recording a monthly jump in new listings and most markets proving far busier than at the same time last year,” said Cameron Kusher, director of economic research at REA Group.
“Sydney and Melbourne recorded a year-on-year jump in new listings, despite the heightened new listing volumes this time last year, while Perth, Canberra and Brisbane saw the largest annual increases.”
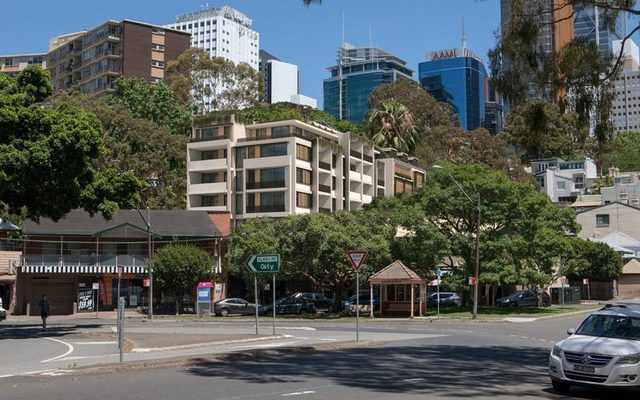
Sydney had its highest volume of new listings in nine years, with an increase of 12.9% for the month and 14.1% for the year.
Both Melbourne and Canberra recorded new highs for new listings, up 33.0% and 31.6% respectively over October and up 12.5% and 19.0% annually.
While both Brisbane and Hobart had their highest number of new listings for October in six years, up 15.4% and 31.1% respectively for the month and 16.0% and 9.4% for the year.
Adelaide reached its highest October volume in five years after an increase of 26.4% annually and 11.5% over the year.
For Perth it was the strongest October for listings for new listings in a decade, after a monthly bump of 30.0% and an annual lift of 28.3%.
“As new listing volumes have surged, total listing volumes have also increased. They’re up 8.7% year-on- year and at their highest point since November 2020,” added Kusher.
With total listings up 7.7% for the month, capital city listings were up 9.3% for the month and 10.4% annually.
While total regional market listings were up 7.7% month-on-month and 6.8% year-on-year.
“Heightened levels of stock for sale affords buyers more choice and removes some purchasing urgency from the market. We’re seeing a more balanced dynamic between buyers and sellers than we have in recent years, with conditions quite favourable for purchasers in cities like Sydney and Melbourne,” said Kusher.
“A range of factors may have led to the strong growth in new listings, such as recent price gains enabling some homeowners to upgrade, while prolonged high interest rates may be prompting others to sell.”