This article is from the Australian Property Journal archive
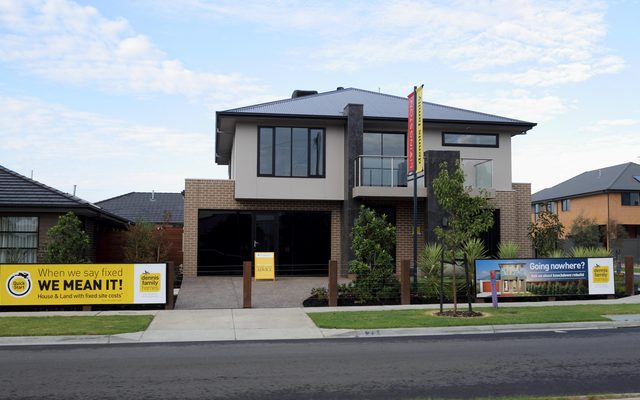
MELBOURNE’S median house price cracked the $750,000-mark for the first time in the final quarter of 2016.
REIV data shows a 5.0% increase in prices to an all-time high $770,000, with double-digit growth seen in 43 of the suburbs that registered more than 30 sales.
The strongest growth was the 25.5% seen in Ringwood East to $900,000, followed by Caulfield South at 24.7% to $1,807,500. Traditional blue-chip suburbs Toorak, Brighton and Armadale followed, and Broadmeadows and Prahran also achieved growth of more than 20%.
Moonee Ponds, Box Hill South and Macleod rounded out the top 10.
The most affordable suburbs included Melton South at $285,000, Kurunjang at $309,000, Melton West at $352,000, Pakenham at $410,000 and Sunbury at $412,000.
They were followed by Werribee, Wyndham Vale, Hampton Park, Cranbourne and Hoppers Crossing.
MELBOURNE MEDIAN HOUSE PRICES: TOP 20 SUBURBS – DECEMBER QUARTER
| Top Growth Suburbs | Dec-16 Median | Sep-16 Median | Quarterly Change | |
| 1 | RINGWOOD EAST | $900,000 | $717,000 | 25.5% |
| 2 | CAULFIELD SOUTH | $1,807,500 | $1,450,000 | 24.7% |
| 3 | TOORAK | $4,762,500 | $3,900,000 | 22.1% |
| 4 | BRIGHTON | $2,740,000 | $2,245,000 | 22.0% |
| 5 | ARMADALE | $2,460,000 | $2,020,000 | 21.8% |
| 6 | BROADMEADOWS | $481,000 | $397,000 | 21.2% |
| 7 | PRAHRAN | $1,685,000 | $1,394,000 | 20.9% |
| 8 | MOONEE PONDS | $1,235,000 | $1,030,000 | 19.9% |
| 9 | BOX HILL SOUTH | $1,316,000 | $1,101,000 | 19.5% |
| 10 | MACLEOD | $925,000 | $775,000 | 19.4% |
| 11 | HAWTHORN | $2,470,000 | $2,080,000 | 18.8% |
| 12 | THOMASTOWN | $567,000 | $477,500 | 18.7% |
| 13 | RINGWOOD NORTH | $950,500 | $815,000 | 16.6% |
| 14 | DONCASTER | $1,398,000 | $1,202,500 | 16.3% |
| 15 | DROMANA | $659,000 | $566,750 | 16.3% |
| 16 | UPWEY | $645,000 | $555,000 | 16.2% |
| 17 | NARRE WARREN SOUTH | $577,500 | $500,000 | 15.5% |
| 18 | LALOR | $560,000 | $487,000 | 15.0% |
| 19 | SPRINGVALE | $727,500 | $635,000 | 14.6% |
| 20 | MOUNT MARTHA | $945,000 | $825,000 | 14.5% |
| Most Affordable Suburbs | Dec-16 Median | Quarterly Change | |
| 1 | MELTON SOUTH | $285,000 | 5.6% |
| 2 | KURUNJANG | $309,000 | 0.5% |
| 3 | MELTON WEST | $352,000 | 1.9% |
| 4 | PAKENHAM | $410,000 | -0.1% |
| 5 | SUNBURY | $412,000 | -3.5% |
| 6 | WERRIBEE | $415,000 | 6.4% |
| 7 | WYNDHAM VALE | $415,000 | 6.4% |
| 8 | HAMPTON PARK | $430,000 | 0.2% |
| 9 | CRANBOURNE | $442,000 | 13.3% |
| 10 | HOPPERS CROSSING | $445,000 | 6.7% |
Unit and apartment prices increased in the quarter by 3.0% to $563,500.
Regional Victoria’s house prices grew 2.0% to $358,000, and unit and apartment prices dipped slightly $269,000.
REIV president Joseph Walton said the last quarter was a very strong closing quarter, with the number of sales increasing, along with solid price results.
“Transaction numbers in the inner and middle suburbs of Melbourne were up more than 20% from the September quarter,” he said.
Walton said the ongoing interest from investors and homebuyers in the Victorian market looked likely to continue well into 2017.
“It is clearly an excellent time to sell, given this level of interest and buyer demand. It continues to drive price growth and high clearance rates,” he concluded.
Australian Property Journal